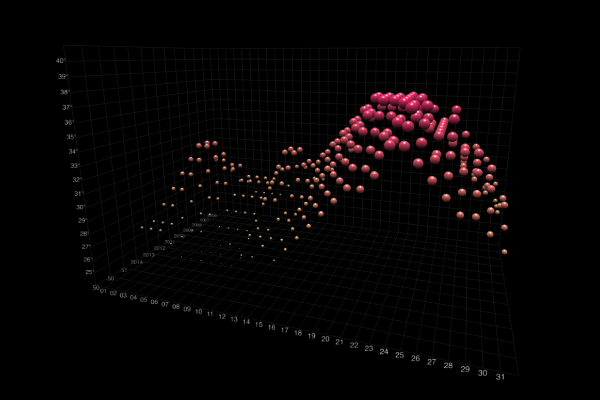
Holographic Visualisations
pyReality is a Python library that lets users rapidly create immersive data visualisations in Jupyter Notebooks. pyReality leverages WebXR to render mixed reality visualisations in browsers making them more accessible. Once created, these visualisations can be viewed using a head-mounted display and configured via the Jupyter Notebooks' interface.
Get started by using the examples provided in the documentation.
Data Scientist?
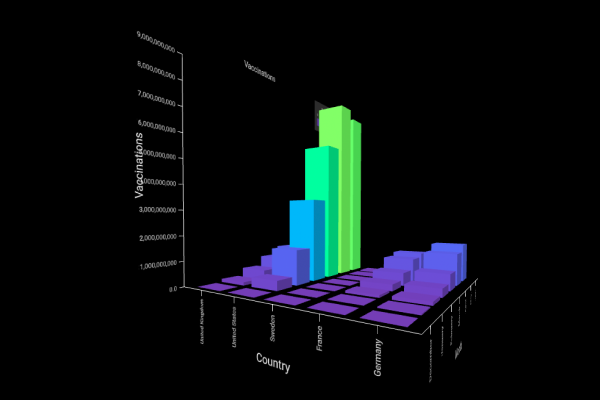
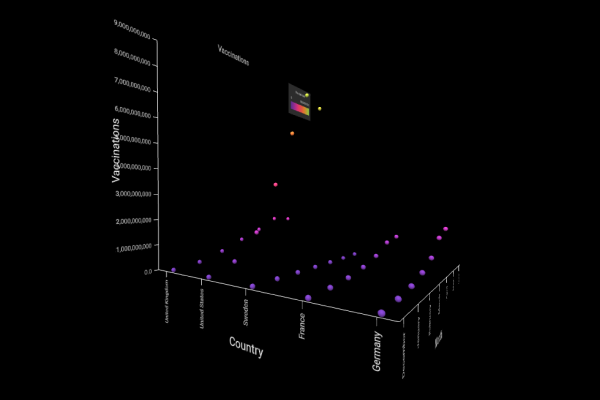
Rapidly visualise data in immersive environments
Creation
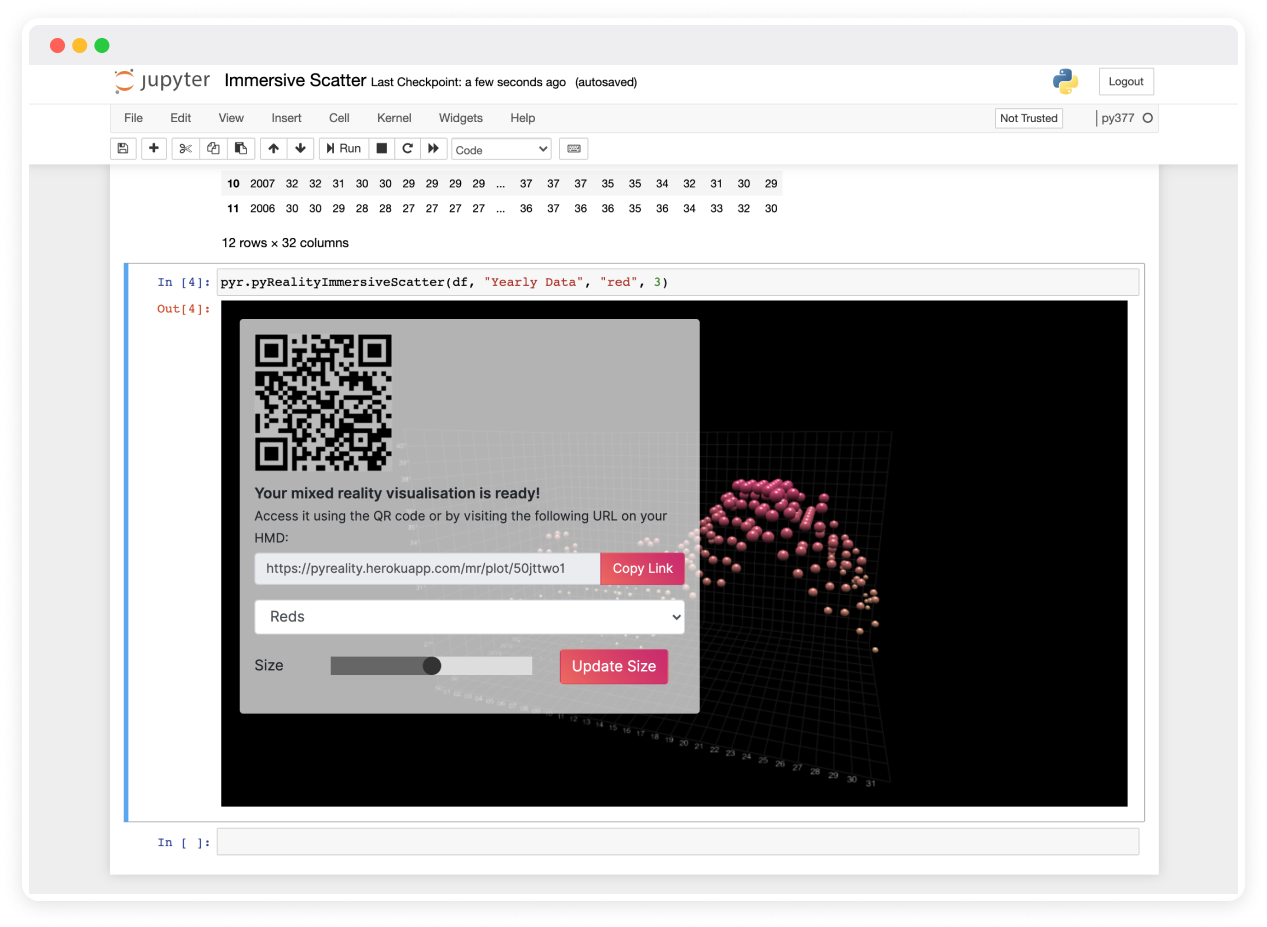
Rapidly create immersive data visualisations from your Jupyter Notebooks interface and view it using an HMD.
Configuration
Visualisation specifications can be controlled from the GUI or via Python code in Jupyter Notebooks.
Performance
Built with VRIA, D3.js and Babylon.js, pyReality utilises WebGL to render large datasets quickly and efficiently.